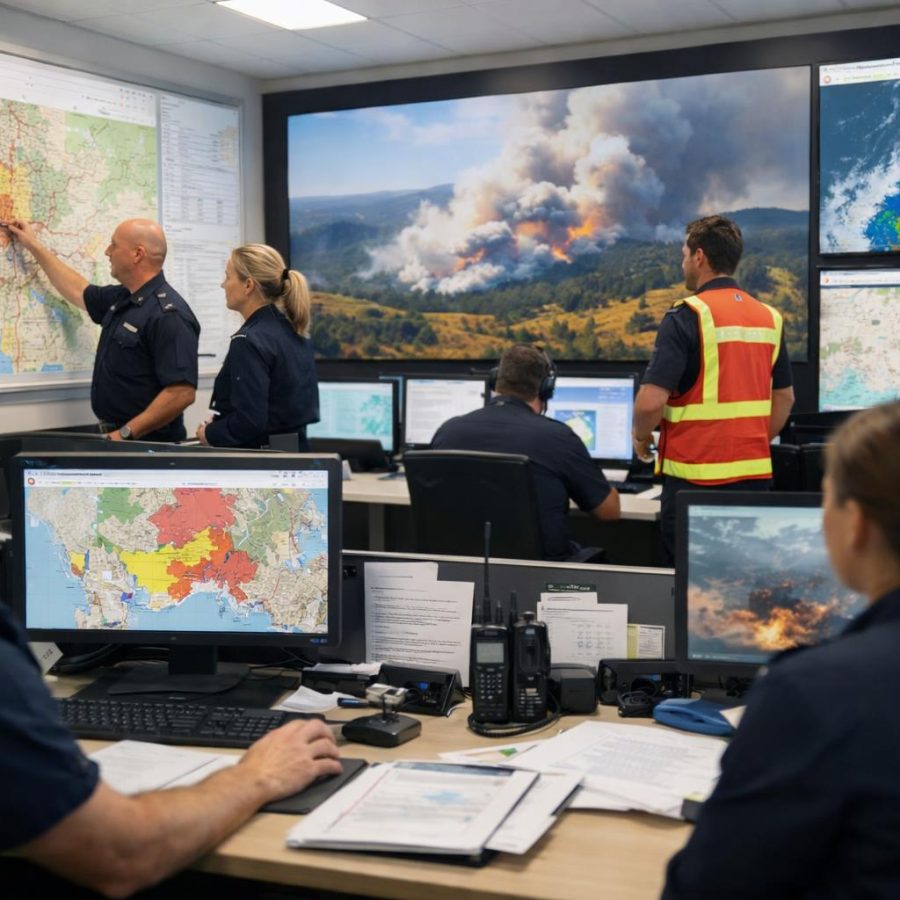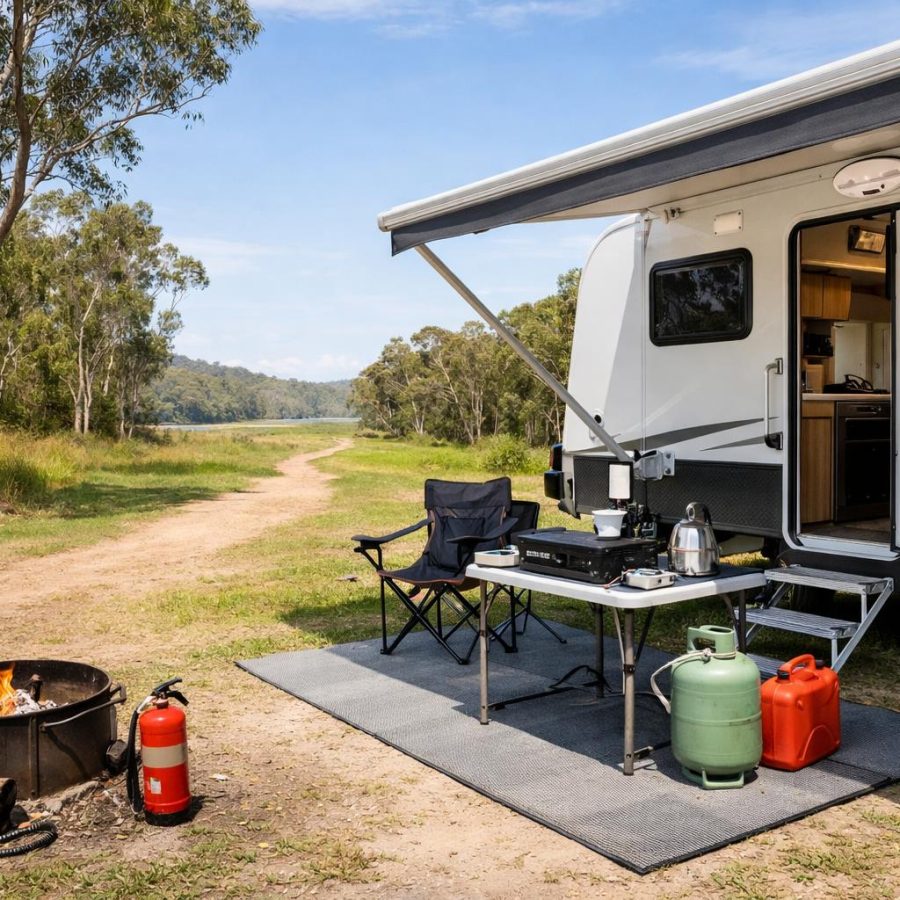
El Niño is established, but Australia is not facing one single, uniform forecast. The latest official outlooks point to a spring and early-summer pattern with higher fire risk in some regions, lower rainfall chances in others, and ongoing flood preparedness needs across the country. The practical message is simple: treat the climate signals as a planning prompt, not as a guarantee of one disaster or another. Originally published June 2026, this update reflects official information checked on 24 September 2026.
Opening verdict: the short version for households and planners
Here’s the plain-English verdict. El Niño is now firmly established, and the Bureau says the event is strong. Seasonal models also point to continued Pacific warming and a likely late-spring or summer peak. At the same time, Australia’s rainfall and fire risks are not the same everywhere. Some regions are leaning drier and hotter. Others, especially parts of western and inland Australia, are favoured for above-average rainfall over October to December.
That’s the main reason this update matters. A strong Pacific signal does not automatically produce one neat Australian outcome. Local soil moisture, stored water, recent rain, fuel loads, wind patterns, the Indian Ocean Dipole, the Southern Annular Mode and the day-to-day weather systems still shape what people actually experience.
Five key points stand out.
- El Niño is established and strong, but the forecast strength remains conditional, not a finished result.
- The October to December outlook is patchy: below-average rainfall is favoured in the south-east and parts of far northern Queensland, while much of western Australia and Queensland’s interior have an above-average rainfall signal.
- Fire risk is already elevated in selected areas of NSW, Queensland, Victoria, Tasmania, South Australia, Western Australia and the NT for spring.
- Drought is not one thing: rainfall deficiency, soil moisture, streamflow and stored water can point in different directions.
- Flooding still matters even in an El Niño season, because intense short-duration rain can still produce dangerous local flooding and storm impacts.
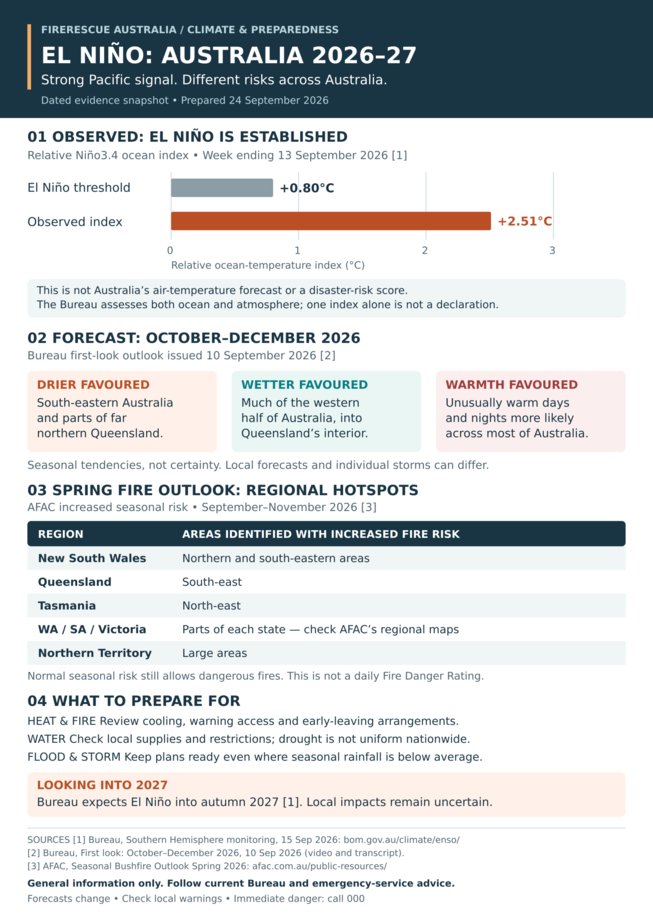
Tap the image to enlarge. Seasonal forecasts are not local warnings.
Sources:
Bureau of Meteorology
and
AFAC Spring 2026 Outlook.
September evidence: what the official monitoring says now
The Bureau’s Southern Hemisphere monitoring, issued on 15 September 2026, describes an established, strong El Niño. For the week ending 13 September, the relative Niño3.4 index was +2.51°C and the 30-day Southern Oscillation Index was −18.5. Those are strong ocean-atmosphere indicators, and they support the view that the El Niño event is well in place.
The same Bureau update says models point to further Pacific warming and a likely peak in late spring or summer. It also notes the possibility of relative Niño index values exceeding previous observations since 1950. That is important, but it needs careful wording. It is a forecast of possible strength, not an already-observed record peak. In other words, the event may intensify further, but it has not yet been confirmed as the strongest on record.
The Bureau also expects the event to persist into autumn 2027. That does not mean the whole of 2027 will behave the same way. Seasonal climate patterns can change through summer, then change again before autumn. For planning, the value of the outlook is that it gives agencies and households extra time to prepare. It is not a daily warning product.
The Indian Ocean Dipole was still classed as neutral in the Bureau material, although one weekly reading exceeded the positive threshold. That does not establish an event by itself. Models favoured a positive IOD developing, but with uncertainty. This matters because the Indian Ocean can either reinforce or soften Australian seasonal patterns. There’s a few things worth checking here: one climate indicator on its own rarely tells the whole story.
It is also worth separating observation from interpretation. The relative Niño3.4 index is an ocean-climate indicator. It is not a forecast of Australia’s air temperature. A strong ENSO index can coincide with very different local weather outcomes depending on how rain-bearing systems, surrounding oceans and wind patterns behave during the season.
How El Niño, the Indian Ocean Dipole and other drivers work together
A lot of confusion comes from treating climate drivers as if they were separate switches that turn Australia dry or wet. They are not. They are better understood as overlapping influences that tilt the odds one way or another. El Niño, the Indian Ocean Dipole, the Southern Annular Mode, surrounding sea temperatures and individual weather systems all shape the seasonal result.
In everyday language, El Niño is one of the big Pacific signals that can shift where moisture and rain bands are more or less likely to form. A positive Indian Ocean Dipole tends to reduce moisture supply from the Indian Ocean and can reinforce dry conditions in parts of southern and eastern Australia. But a neutral IOD, or warm surrounding seas, can still help fuel rain systems when the atmosphere lines up in the right way.
That is why seasonal forecasts are stated in probabilities rather than certainties. They are not promises. They are statements about which outcomes are more likely than usual over a set period. A season can still include wet weeks, intense storms, or local flooding even when the larger climate background looks dry overall.
The Bureau’s explanatory material notes that El Niño commonly favours reduced rainfall across eastern Australia and warmer conditions in southern Australia, particularly in winter and spring. It can also favour an earlier southern fire season start, a later northern monsoon onset and fewer Australian-region tropical cyclones on average. But those are tendencies, not guarantees. A few storms can still deliver a lot of rain. One hot spell can still drive dangerous fire behaviour. One cyclone can still cause major damage and flooding.
For emergency planning, the practical lesson is to use the whole picture. If the seasonal outlook, local fuel state and water situation are all leaning the same way, preparedness should move up a gear. If they point in different directions, the response should still be based on local exposure, not on a headline.
October to December outlook: where wetter conditions are favoured and where caution remains
The Bureau’s dated first-look outlook for October to December 2026, issued on 10 September 2026, is the key forecast window for this update. It favours below-average rainfall in the south-east and parts of far northern Queensland. It favours above-average rainfall across much of the western half of Australia, extending into Queensland’s interior. Both daytime and night-time temperatures show an increased chance of unusual warmth across most of Australia.
This is the correction to the oversimplified idea that El Niño always means everyone gets drier. It does not. The seasonal rainfall signal is uneven, and it also does not describe the timing of individual storms. A season can be below average overall and still produce a damaging downpour. It can also be above average overall and still have long dry stretches between rain events.
For practical planning, the rainfall outlook interacts with existing ground conditions. The Bureau’s 7 September 2026 drought and water availability assessment found serious or severe rainfall deficiencies over the preceding 24 months in parts of south-west Western Australia, South Australia’s Mid North, southern Victoria, the NSW Riverina and eastern Tasmania. In August, those deficiency areas expanded or intensified in south-west WA and eastern Tasmania, while contracting in Victoria, NSW and South Australia.
At the same time, root-zone soil moisture was above average across much of the interior, extending into South Australia, while below-average soil moisture had expanded in eastern areas. That split matters. Rain falling onto dry subsoil does not have the same effect as rain falling into already moist catchments. And wetter inland areas do not necessarily remove fire risk if surface fuels dry later.
The table below gives a simple comparison of what the forecast is saying and what it is not saying.
| Forecast element | What the Bureau outlook suggests | What it does not mean |
|---|---|---|
| Rainfall | Below average favoured in the south-east and parts of far northern Queensland; above average favoured across much of western Australia and Queensland’s interior | Not a promise that every town in those regions will be dry or wet |
| Temperature | Increased chance of unusual warmth across most of Australia | Not a prediction that every day will be hot, or that every region will experience the same intensity |
| Season length | Relevant to October to December 2026 only | Not a forecast for the whole summer or all of 2027 |
| Storm timing | No specific timing signal | Not a shield against intense storms or local flooding |
If you are planning for a community event, farm operation or business continuity, use the forecast as a trigger to refresh contingencies, not as a reason to stop looking at local weather reports. There is no substitute for current Bureau forecasts and state or territory warnings once severe weather starts to develop.
Drought and water: why the same season can feel different depending on what you measure
One of the biggest mistakes in climate discussion is to treat drought as a single number. It is not. Rainfall deficiency, soil moisture, streamflow, groundwater and stored water all tell different parts of the story. A place can have a rainfall deficit without having reached a water-supply crisis. It can also have decent recent rain and still be struggling with deep soil moisture deficits or low streamflow from earlier dry periods.
The Bureau’s 7 September assessment shows that this spring and early-summer period begins with substantial regional variation. Serious or severe rainfall deficiencies have affected parts of south-west WA, the SA Mid North, southern Victoria, the NSW Riverina and eastern Tasmania over the previous 24 months. That is a long enough window to matter for pasture, crops, creek flow and dam recovery, but not all impacts will look the same on every property.
Root-zone soil moisture is especially important for growers and rural property owners. It affects how quickly pasture and crops respond to rain, how much water stays available after a shower, and how fast vegetation dries again during warm, windy periods. The Bureau reported below-average root-zone soil moisture in parts of eastern Queensland, coastal and north-eastern NSW, south-eastern Victoria, WA and Tasmania. Some inland areas remained wetter than average.
That split produces different risks. Where soil moisture is low, planting decisions, fodder planning and stock water supply can tighten quickly if rainfall stays patchy. Where soil moisture is above average, there may be more short-term resilience, but also the possibility of stronger grass growth that later cures into fuel if heat and wind return. That is a common but often overlooked pathway to increased fire risk.
Streamflow and groundwater are different again. A catchment with low streamflow can still receive a useful rain event that improves pasture without fully restoring creeks and dams. A full dam in one district does not help a neighbour in the next valley. So the right question is local and practical: what is happening to the specific water sources that support this property, this town or this district?
Do not use one dry month, a national average or an El Niño label as proof of drought at a property. Measure the actual indicators that matter locally: rainfall, soil moisture, water storage and streamflow.
For households, this can be as simple as checking tank levels, reviewing water restrictions, and making sure garden and household water use are matched to local conditions. For farms, it means watching pasture cover, stock water, irrigation supply and feed budgets. For councils and organisations, it means looking at the reliability of local water assets and the ability to operate through a hot, dry spell.
Bushfire and grassfire: the real risk comes from fuels, weather and access
AFAC’s spring 2026 seasonal bushfire outlook identifies increased fire risk in northern and south-eastern NSW, south-east Queensland, north-eastern Tasmania, parts of Western Australia, South Australia and Victoria, and large areas of the Northern Territory. These are selected areas, not whole states. The outlook covers spring, September to November, and should not be stretched into a formal summer forecast.
AFAC’s method combines fuel conditions, previous weather and climate forecasts. That is useful because fire risk is not just about how hot the weather is. It also depends on how much burnable material exists, how dry it has become, how fast wind can spread flames, whether ignition sources are present, and whether crews can reach the area quickly. A community with normal seasonal risk can still have a serious fire if fuels are dry and access is limited.
NEMA’s accompanying spring assessment highlights low soil moisture in NSW and Queensland and high fuel loads in parts of the NT as contributing factors. That gives two different pathways to fire risk. One is drying vegetation, which can make forests, scrub and grasslands more combustible. The other is abundant grass or other fuels that have grown after rain and then cured under heat. Either pathway can produce dangerous fire behaviour once wind and ignition line up.
There’s a few things worth checking in fire planning this season:
- Whether local vegetation is curing faster than usual.
- Whether access roads, gates and water points are still serviceable.
- Whether ember exposure is high because of nearby bush, grass or unmanaged edges.
- Whether the plan relies on late evacuation when roads may already be congested or cut.
- Whether the property has enough time, labour and equipment to defend only if it is safe and authorised to do so.
Public action versus trained responder action matters here. Household and property owners should prepare, reduce fuel where permitted, and have a clear leave early plan. They should not attempt fire attack beyond their training, equipment and legal authority. Fire agencies and land managers make operational decisions about suppression, backburning and exclusion zones.
Another common misunderstanding is to equate seasonal outlooks with daily Fire Danger Ratings. They are different tools. The seasonal outlook looks at the broader months ahead. Fire Danger Ratings and incident warnings look at the actual current weather, fuel and fire behaviour risk for a specific day or period. A place can have a normal seasonal outlook and still reach severe or extreme ratings on a bad day.
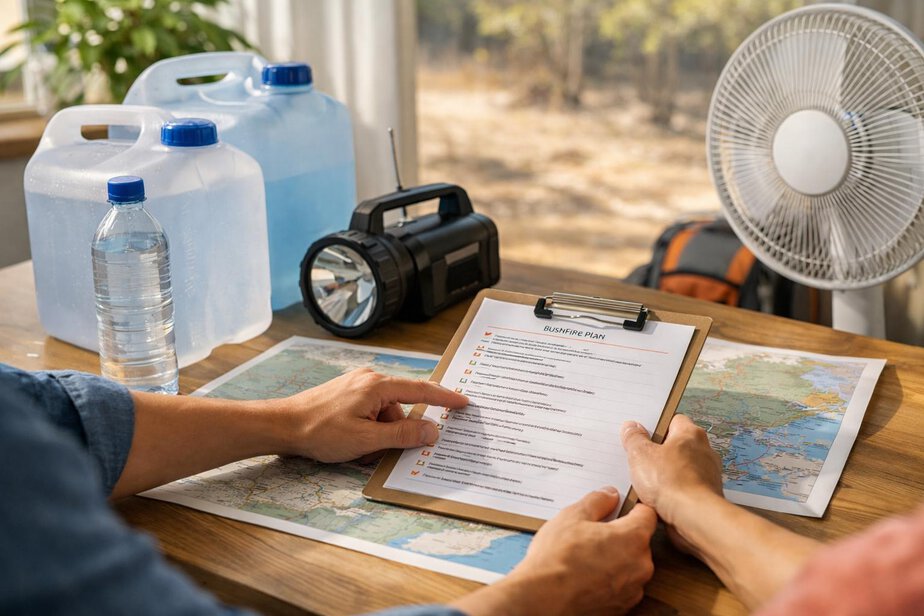
For households in fire-prone areas, the simplest preparation is still the most effective: know your trigger for leaving, clear gutters and flammable material where safe, service pumps and sprinklers if used on the property, keep vehicles fuelled during high-risk periods, and make sure your emergency contacts and evacuation route are current.
Heatwaves: warmth, warm nights and vulnerability during a power outage
The Bureau’s outlook for October to December shows an increased chance of unusual warmth across most of Australia, including both daytime and night-time temperatures. Night-time warmth is especially important because it reduces the body’s chance to recover from daytime heat. That can make multi-day heat events much more dangerous, especially for older people, young children, people with chronic illness, outdoor workers and those dependent on electrical medical equipment.
Heat risk is not just a weather story. It is a service continuity story. If power fails during a hot period, cooling appliances, refrigeration, communications and some medical equipment can all be affected. A house that is normally manageable in summer can become unsafe very quickly if there is no backup cooling plan, no shade, and no ability to move to a cooler place.
Healthdirect’s hot-weather guidance is clear about the practical basics: stay cool, drink water, reduce strenuous activity in hot periods, and check on vulnerable people. Suspected heatstroke is an emergency and requires a call to Triple Zero (000). People with prescribed fluid restrictions need individual medical guidance rather than generic advice. Do not try to improvise medical treatment in the field.
For employers and community organisations, the planning question is whether people can work safely when temperatures rise unexpectedly. That includes outdoor workers, transport crews, maintenance teams, event staff and volunteer groups. It also includes whether there are safe rest breaks, shaded areas, drinking water, communication systems and a simple escalation trigger if someone starts showing heat illness signs.
A sensible heat plan should also consider sleep disruption. Warm nights can leave people tired and less able to cope the next day. That matters for drivers, machinery operators, first responders, carers and anyone doing physically demanding work. Put another way: a hot night can make a hot day worse.
Floods, storms and tropical cyclones: why preparedness still matters in an El Niño season
It is tempting to assume that a dry-leaning season means flood risk can go to the back of the cupboard. That would be a mistake. Below-average seasonal rain does not rule out a damaging downpour, and significant floods can occur outside La Niña years. Flood outcomes depend on rainfall intensity and duration, catchment wetness, and local drainage and terrain conditions.
The Bureau and CSIRO’s State of the Climate 2024 reporting says Australia is seeing increasing extreme heat, more intense short-duration heavy rainfall, and increased extreme fire weather and longer fire seasons across large parts of the country. Those are long-term climate findings, not a numerical forecast for this summer. But they do support one important planning point: the background risk of very intense rain has not disappeared just because El Niño is present.
Storm damage also remains a separate issue. Strong winds, hail and embedded thunderstorms can damage roofs, power lines, crops and transport corridors even when seasonal rainfall totals are below average. In some places, the main issue is not flood extent but flash flooding, road closures and isolation.
The same is true for tropical cyclones and ex-tropical systems. El Niño can tend to reduce the number of cyclones in the Australian region on average, but fewer cyclones does not mean no cyclone, and it does not remove the risk of destructive landfall or cyclone-related flooding. Do not rely on an assumed cyclone count. Use a verified seasonal outlook when one is available, and update plans when the Bureau issues cyclone warnings.
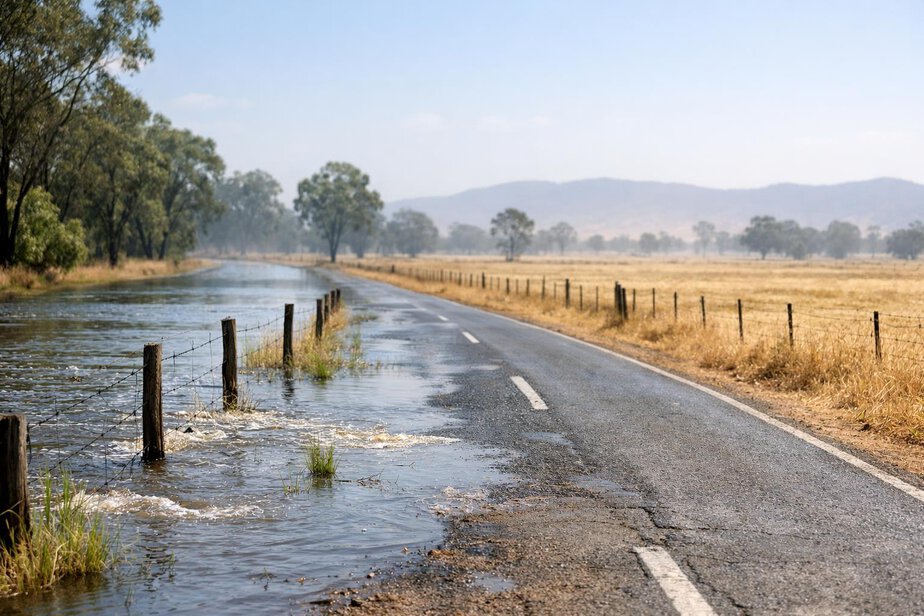
Never drive, ride or walk through floodwater. That applies even if the water looks shallow or the road appears familiar. Floodwater can conceal washouts, debris, contamination and strong currents. Public safety advice is simple because the danger is real.
Regional outlook table: verified signals and practical planning considerations
The table below separates what is actually supported by the current official material from the broader planning implications that households and agencies may want to consider. It is not a suburb-by-suburb forecast and should not be read that way.
| Region | Verified seasonal outlook | Planning implications |
|---|---|---|
| NSW / ACT | AFAC spring outlook highlights increased fire risk in northern and south-eastern NSW. Bureau October to December outlook favours below-average rainfall in the south-east. | Review fire plans, evacuation triggers, water security and heat response. Do not assume a dry trend removes flash-flood risk from intense storms. |
| Victoria | AFAC identifies increased fire risk in parts of Victoria. Bureau reports rainfall deficiencies in southern Victoria and below-average soil moisture in south-eastern Victoria. | Check household and council emergency plans, farm water supplies, and preparedness for heat, wind and smoky conditions. |
| Queensland | AFAC identifies increased fire risk in south-east Queensland. Bureau favours below-average rainfall in parts of far northern Queensland, but above-average rainfall across Queensland’s interior. | Plan for both heat/fire stress and localised heavy rain in different parts of the state. Inland communities should not assume the same pattern as coastal areas. |
| South Australia | AFAC identifies increased fire risk in parts of SA. Bureau notes rainfall deficiencies in the SA Mid North, while root-zone soil moisture remained above average across much of the interior extending into SA. | Some districts may still have usable subsoil moisture, but fire conditions can worsen quickly if surface fuels dry. Check water, fodder and access. |
| Western Australia | AFAC identifies increased fire risk in parts of WA. Bureau favours above-average rainfall across much of the western half of Australia, and serious/severe rainfall deficiencies remain a concern in parts of south-west WA. | Do not treat “above-average rainfall favoured” as a guarantee of local relief. Western and south-western districts may still need fire and water planning. |
| Tasmania | AFAC identifies increased fire risk in north-eastern Tasmania. Bureau reports serious or severe rainfall deficiencies in eastern Tasmania and below-average soil moisture in parts of Tasmania. | Check fire access, property defence options, and water storage. A wet spell can help fuels grow, then cure later if warmth returns. |
| Northern Territory | AFAC identifies increased fire risk across large areas of the NT. NEMA notes high fuel loads in parts of the NT as a contributing factor. | Monitor grass curing, access tracks and ignition sources. Preparedness should focus on rapid spread potential and safe access for responders. |
This regional summary is deliberately cautious. It uses the verified outlooks available on 24 September 2026 and avoids turning one seasonal signal into a fixed local prediction. If you need finer boundaries, use the relevant state or territory fire maps and current warnings rather than relying on a state-wide label.
Emergency-planning table: hazard, evidence, consequence and trigger for action
The next table is designed for households, farms, schools, community organisations and small businesses. It is not a command plan. It is a prompt for review and discussion.
| Hazard | Evidence base | Possible consequence | Action | Trigger for reviewing the plan |
|---|---|---|---|---|
| Bushfire / grassfire | AFAC spring outlook, NEMA spring assessment, dry fuels or curing grass | Loss of access, property exposure, smoke impacts, ember attack | Check leave early plan, clear around assets where permitted, confirm equipment and contacts | When surface fuels dry, wind rises, or local fire danger ratings lift |
| Drought / water stress | Bureau rainfall deficiency and soil moisture assessment | Reduced pasture, irrigation stress, tank or dam pressure, supply restrictions | Review water use, stock feed, watering priorities and backup supply options | When rainfall stays below average or local water sources keep falling |
| Heatwave | Bureau outlook shows increased chance of unusual warmth across most of Australia | Heat illness, poor sleep, equipment strain, power dependence | Prepare cool spaces, water, welfare checks and backup power or relocation options | When hot nights persist, vulnerable people are exposed, or outages are forecast |
| Flood / storm | Climate variability plus long-term evidence of intense short-duration rainfall | Flash flooding, isolation, road closures, roof or tree damage | Know road alternatives, secure loose items, monitor warnings, avoid floodwater | When heavy rain, thunderstorms or river warnings are issued |
| Combined events | Hot, dry, windy periods can overlap with outages or smoke | Multiple disruptions at once | Plan for communication loss, transport disruption and welfare checks | When more than one hazard is building at the same time |
Household, farm and organisation checklists
The best plans are short, specific and already discussed before the weather turns. Different users need different checklists, but the core idea is the same: reduce surprise.
Households
- Confirm your bushfire, heat and flood triggers for action.
- Make sure everyone knows how to receive warnings and who checks on whom.
- Prepare a cool room or alternative cooling option if power fails.
- Keep drinking water, medications and essential items easy to access.
- Know the safest way out of your area if you need to leave early.
- Do not plan to drive through floodwater under any circumstances.
Rural properties and farms
- Review stock water, feed, fencing, access tracks and pump reliability.
- Check grass curing, fuel loads, and whether firebreaks are still serviceable where permitted.
- Move critical machinery, fuel and chemicals to safer locations where appropriate and lawful.
- Have a clear separation between what family members can do and what trained responders will do.
- Keep a current map of gates, water points, hazards and alternative exits.
Community organisations and businesses
- Review business continuity plans for heat, power loss, smoke and road closures.
- Check welfare arrangements for staff, clients, volunteers and visitors.
- Test communications trees and backup contact methods.
- Make sure work arrangements for hot weather are safe and realistic.
- Identify which operations can stop, move or scale down during extreme conditions.
Public safety reminder: if a situation is moving toward immediate danger, the correct step is to act early and follow official instructions. Households should prepare and leave early where required; trained responders will manage incidents within their authority.
What can responsibly be said about summer 2026–27 and early 2027
There is a clear temptation to turn a spring outlook into a dramatic summer prophecy. That would not be responsible. The official material available on 24 September 2026 supports a more careful conclusion. It is fair to say that Australia is entering the warm season with a strong El Niño, a likely positive IOD developing, elevated fire risk in several selected regions, below-average rainfall favoured in some eastern areas, and unusual warmth more likely across much of the country.
It is also fair to say that this does not equal one national disaster scenario. Summer weather will still depend on the timing of rain systems, the behaviour of local fronts and troughs, moisture supply from surrounding seas, and how the atmosphere evolves through late spring. The Bureau’s own material makes clear that a strong ENSO index does not guarantee equally strong Australian impacts.
For early 2027, the most prudent statement is that elevated preparedness should continue beyond the Christmas-New Year period if the climate drivers and local conditions remain aligned toward heat, dryness or fuel accumulation. But that is an operational readiness message, not a forecast that every area will experience the same hazard mix.
So the responsible answer is this: expect variability, not certainty. Expect some regions to dry out, some to receive helpful rain, and some to do both at different times. Expect heat to remain a major issue. Expect localised flooding and storm impacts to remain possible. And expect fire agencies, health services, councils and households to be busiest when people wait too long to respond.
FAQs and references
Is El Niño a guarantee of drought across Australia?
No. El Niño commonly favours reduced rainfall in eastern Australia, but the effect is not uniform and does not override all other climate drivers. Some areas can still have above-average rain, especially over short periods.
Does a positive Indian Ocean Dipole mean the season is already locked in?
No. A single weekly reading does not establish an event. Seasonal behaviour depends on whether the IOD becomes established, how long it persists, and how it interacts with other drivers and weather systems.
Should we treat the Bureau’s rainfall outlook as a local forecast for our suburb?
No. Seasonal outlooks describe broad probabilities over a period. They are useful for planning, but they do not replace local forecasts, warnings or fire danger ratings.
If rainfall is below average, does that mean floods are off the table?
No. Short, intense rainfall can still produce flash flooding, local drainage problems and transport disruption even in a dry-leaning season.
Can houses rely on normal fire season dates this year?
Not safely. Fire seasons can start earlier or become more active when fuel conditions and weather line up. Use local fire services and the current seasonal outlook rather than old assumptions.
What is the most useful thing to do now?
Review your household or organisational plan, check water, cooling and evacuation arrangements, and make sure everyone knows the trigger for action before a warning is issued.
References used in this update: Bureau Southern Hemisphere monitoring, issued 15 September 2026; Bureau first-look October to December 2026 forecast, issued 10 September 2026; Bureau drought and water availability assessment, 7 September 2026; AFAC Seasonal Bushfire Outlook Spring 2026, August 2026; NEMA spring bushfire assessment, 19 August 2026; Bureau El Niño explanatory material; Bureau/CSIRO State of the Climate 2024; Healthdirect hot-weather guidance; VICSES flood guidance.
General preparedness information only, not a property-specific assessment or live warning. Follow Bureau forecasts and state or territory emergency services advice, and verify local conditions and procedures before publication or operational use.
FireRescue Training Hub
Access practical fire and emergency study support resources, downloads, checklists, audio guides, and member-only course content.
- Course library
- PDF downloads
- Audio guides
- Checklists
Study support only. Not accredited training or a replacement for workplace procedures.
About the author and safety review
Ken Walker
Former Station Officer and fire service educator
Former career firefighter with extensive career and volunteer fire service experience.
Qualifications: Associate Diploma of Applied Science in Fire Technology; Institute of Fire Engineers studies.
Author profilehttps://www.firerescue.com.au/about-us/